Research and Data Tools
SHARE
SHARE
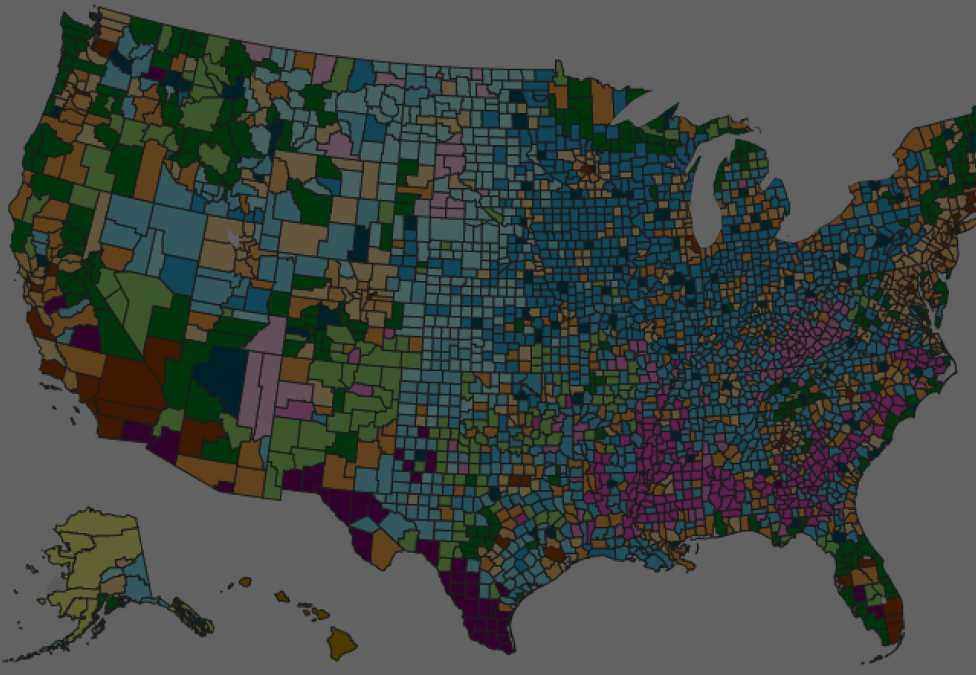
The Community Explorer is an interactive tool that brings the power of big data and machine learning to the equity-related policy discussion. It groups a wide variety of data—from economic and demographic numbers to education, housing, and health features— at the county level to tell a deeper story than when using a few indicators at one time. More specifically, it synthesizes the information of 751 variables across 3,142 counties from the Census Bureau’s American Community Survey using machine learning methods in 17 communities. Each one of these communities has a distinctive profile that combines demographic, economic, and many other behavior determinants while not being geographically bounded. View the interactive tool below and for a faster experience, visit this page.
The Community Explorer interactive tool allows for two ways to access the data:
1. County-focused displays the information from the perspective of the communities created by our analysis, presenting the different socio-economic aspects of each county in each community. The headline contains active county information, while the bottom provides the possibility to access 29 interactive charts with detailed information about a county, profile, and the US average for each variable.
2. Variable-focused displays the information from the perspective of (only) one variable while still providing unique information about counties and communities at the tooltip. The two dropdowns allow the grouping of the data by the communities and chart categories used in the “County-focused” display.
**Select or search a county, profile, or group of profiles using the drop-down menus on the top of the map. Use drop-down menus on the top of the charts to select differently.
These profiles can be summarized as follows:
Urban America captures 74 percent of the US population spread across 819 urban core, suburban, and small metro counties.
1-Urban Core => Prosperous, ethnically and linguistically diverse large metro areas with substantial disparities between their highly educated (largely White ) and less educated (largely Black or African American) residents (26 percent of the population)
2-Lower-Middle Class => Less populous suburban and small metro counties that are not as economically prosperous as the rest of Urban America (18 percent of the population)
3-Affluent Suburbs => Affluent and more populous (but less diverse) suburban and small metro counties that jointly represent the profile with the highest median income (16 percent of the population)
4-Middle Class => Middle-class communities with a largely White population that resides in large- to medium-sized suburban and small metro counties (14 percent of the population)
Industry-Driven America captures 17 percent of the US population spread across 1,507 counties in which employment is concentrated in one industry that shapes all aspects of the population’s profile.
5-College Towns => College towns with a relatively young, highly educated, and highly geographically mobile population (5.4 percent of the population)
6-Manufacturing Midwest => Counties primarily located in the Midwest that form the profile with the highest proportion of White population working in the manufacturing sector (5.2 percent of the population)
7-Low-Wage Manufacturing => Low-wage workers in the manufacturing and chemical industries located largely in the South and Northeast regions of the country, with an above-average proportion of the population living below the poverty line (4.9 percent of the population)
11-Hispanic Agriculture => Highly agricultural communities with a higher than average concentration of Hispanic or Latino population residing mostly in the West and South (1.2 percent of the population)
15-The Great Plains => Agricultural counties located in the Great Plains with a high proportion of the White population (0.3 percent of the population)
Graying America captures 5.1 percent of the US population spread across 424 counties that jointly represent the highest concentration of population age 65 years or older.
8-Retiree Communities => Retiree communities with adequate household incomes and access to economic resources (4.5 percent of the population)
13-Isolated Seniors => Isolated seniors with high disability rates and relatively low incomes (0.6 percent of the population)
Extremely Vulnerable America captures 3.5 percent of the US population spread across 378 counties that represent the profile with the lowest levels of income.
9-Hispanic Southern Border => Counties mostly located along the US southern border with a majority of a relatively young Hispanic or Latino population living in extreme poverty (1.4 percent of the population)
10-Black South => Southern counties with the highest proportion of Black or African American population and lowest median household income of all profiles (1.3 percent of the population)
12-White Appalachia => White communities in Appalachia with the third-highest level of unemployment rates and second-lowest household income of all profiles (0.7 percent of the US population)
16-American Indian Reservations => American Indian Reservation communities living in extreme poverty with more than one-third of the population with income below the poverty line (0.1 percent of the population)
Noncontiguous America captures 0.42 percent of the US population spread across 14 counties that combine all Hawaiian and nine Alaskan counties.
14-Hawaii => The Aloha State with high racial and ethnic diversity, high income, and relatively low-income inequality (0.4 percent of the population)
17-Native Alaska => Alaskan communities with large economic gaps between the White and Alaska Native populations (0.02 percent of the population)
Data
Census Bureau's American Community Survey.
Related Projects
- The Community Explorer (8 profiles based on 26 factors)
- The Community Explorer: Informing Policy with County-Level Data
- COVID-19 Community Explorer (17 Profiles)
- COVID-19 Community Explorer (8 Profiles)
- Weighing Down America: 2020 Update
SHARE