LOS ANGELES—The Milken Institute’s annual Best-Performing Cities index for 2015 shows that tech is tops, as cities that excel in innovation increasingly drive the nation’s economic dynamism. With an ecosystem for entrepreneurship, San Jose, California, claimed the top spot, up three ranks from last year.
“More than ever, America’s best-performing cities demonstrate what we call the innovation advantage,” says Ross DeVol, chief research officer of the Milken Institute and one of the report’s authors. “That is witnessed not just in ‘traditional’ technology but in the importance of software, social media and even cutting-edge health innovation.”
The Milken Institute’s annual Best-Performing Cities index, compiled since 1999, uses a comprehensive, fact-based set of criteria to rank 200 large and 201 small metros across the United States. As an outcomes-based index, growth in employment, wages and technology output are heavily weighted; metrics such as cost-of-living and quality-of-life conditions, often highly subjective, are not included.
Highlights from “2015 Best-Performing Cities: Where America’s Jobs Are Created and Sustained” include:
- Top-ranked San Jose’s tech-fueled economy is red-hot, with high job growth and average annual earnings of $116,000, versus $61,500 for the nation overall. Venture capital investment of nearly $10 billion notched the highest total since 2000.
- San Francisco, last year’s No. 1, was a close second, with a labor-force participation rate 10 percentage points higher than the national average. In all, California scored six of the top 25 slots among large metros, the most of any state, demonstrating how innovation economies can offset high business costs and a restrictive regulatory environment.
- Colorado captured four spots in the top 25 metros, while Texas has three, compared with seven in 2014. The slowdown in shale-oil exploration dented metros in the Lone Star state and elsewhere in the energy economy.
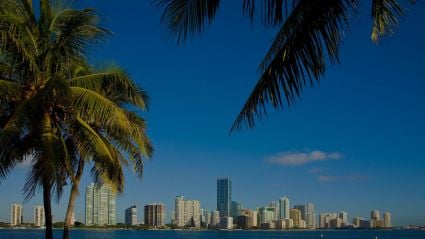
- Eight of the 25 biggest gainers among large metros were in Florida, with Port St. Lucie jumping 98 spots from last year, the most of any metro.
- Fargo, ND-MN, retained its top spot among small metros; its rapidly diversifying economy overcame its exposure to the energy downturn.
“This year’s Best-Performing Cities index tells a tale of two sectors—technology and oil—moving regional economies in opposite directions,” says DeVol. “In the shale oil patch, plummeting energy prices are undercutting the performance of those metros reliant on the sector, such as Tulsa and El Paso. But in Top 25 cities such as San Francisco, Austin, Seattle and Denver, the softer side of high tech is fueling urban economies, with stellar job and wage growth. As cities across America focus on fostering high-quality jobs, our best-performing cities are showing the way.”
Top 10 Best-Performing Large Cities
|
Metropolitan statistical area (MSA) |
2015 rank |
2014 rank |
Change |
|
San Jose-Sunnyvale-Santa Clara, CA |
1 |
4 |
+3 |
|
San Francisco-Redwood City-South San Francisco, CA |
2 |
1 |
-1 |
|
Provo-Orem, UT |
3 |
3 |
0 |
|
Austin-Round Rock, TX |
4 |
2 |
-2 |
|
Dallas-Plano-Irving, TX |
5 |
9 |
+4 |
|
Raleigh, NC |
6 |
5 |
-1 |
|
Seattle-Bellevue-Everett, WA |
7 |
11 |
+4 |
|
Portland-Vancouver-Hillsboro, OR-WA |
8 |
16 |
+8 |
|
Greeley, CO |
9 |
14 |
+5 |
|
San Luis Obispo-Paso Robles-Arroyo Grande, CA |
10 |
24 |
+14 |
2015 Best-Performing Cities: Where America’s Jobs Are Created and Sustained, by Ross DeVol, Minoli Ratnatunga and Armen Bedroussian, is available for download at http://best-cities.org. Data for all metros is available on the interactive “Best-Performing Cities” website. Join the Twitter conversation at #bpcfor2015.


