Research and Data Tools

SHARE
SHARE
Log in or create a free account to download
Full Report
The Milken Institute’s Best-Performing Cities index tracks the economic performance of approximately 400 US metropolitan statistical areas (MSA). It uses an outcomes-based set of metrics—including job creation, wage gains, and high-tech GDP growth—to evaluate the performance of these cities relative to one another.
Cities drive economic growth nationwide. They are the primary locations where businesses create new jobs and workers earn higher wages, keeping the United States competitive in the global economy. However, metro areas are also incredibly diverse. Each has unique characteristics generated through a combination of investment and policy choices that influence the community’s economic outcomes.
Read the Best Performing Cities 2021 Executive Summary.
Find Your City
Tier 1 Large and Small Metros Concentrated in Several Regions
Metropolitan Statistical Areas (MSAs) and Metropolitan Divisions by 2021 Rank
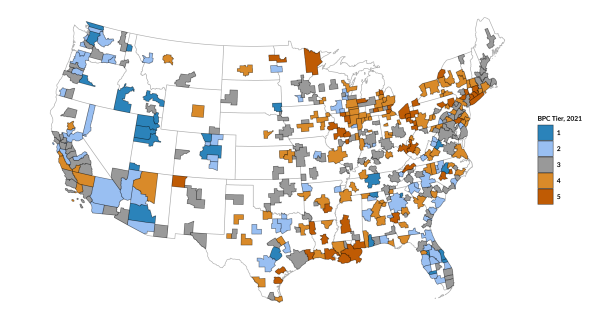
Note: MSAs in Hawaii and Alaska, not shown here, scored in Tiers 4 and 5
Source: Milken Institute analysis (2021)
The top-performing metros have cohesive strategies allowing them to weather economic storms and leverage their assets more effectively. The experience of these metros also provides a benchmark for leaders in other regions seeking to promote sustainable growth and prosperity.
This year, additional criteria were used to determine the rankings, including broadband access and housing affordability. The new metrics reflect the upheaval of 2020, and the shifting markers of a city’s success in a year defined by stay-at-home orders and social distancing.
Top 13 Large Cities
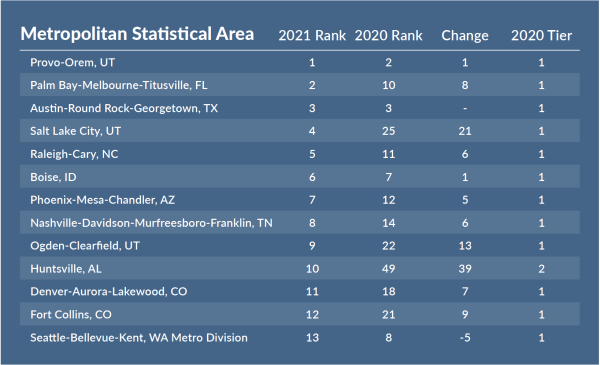
Source: Milken Institute analysis (2021)
Top 5 Small Cities
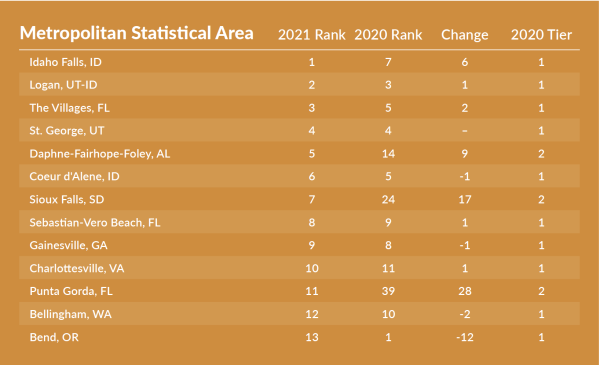
Source: Milken Institute analysis (2021)
SHARE