

Methodology | Best-Performing Cities
The Best-Performing Cities (BPC) report and rankings use the geographic boundaries of cities defined by the Office of Management and Budget (OMB) delineations of metropolitan statistical areas (MSAs) adopted in April 2018.(1) The OMB defines an MSA as a metropolitan area having “at least one urbanized area of 50,000 or more population, plus adjacent territory that has a high degree of social and economic integration with the core as measured by commuting ties.”(2)
Certain MSAs with a single urban core of at least 2.5 million people are further divided into metropolitan divisions (MDs).(3) As of April 2018, the OMB identifies 383 MSAs across the US (excluding US territories and freely associated states) , of which 11 are further divided into 31 MDs. We define cities using the smaller unit of analysis when available, meaning that the BPC ranking includes 372 MSAs and 31 MDs. The resulting 403 metropolitan areas are divided into 200 large and 203 small cities according to the population size as of 2022.
The BPC rankings are calculated using a combination of short- and medium-term measures that fall into three general categories: labor-market performance, high-tech impact, and access to economic opportunities. The 13 measures included in the rankings, classified into their respective categories, are displayed in the chart below:
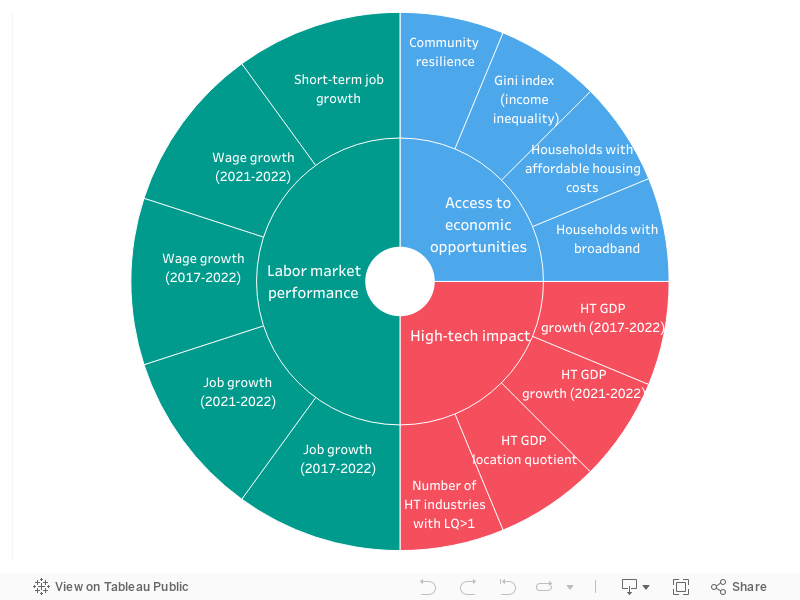
Given the BPC’s focus on economic growth and employment, short- and medium-term job and wage growth are assigned a higher weight in the index. These measures evaluate the extent to which cities successfully leverage their resources to promote economic growth and maintain a thriving work environment. Reflecting the growing importance of the high-tech sector, the BPC index also includes four measures of high-tech industries’ growth and concentration in metropolitan areas relative to the national average. The nine indicators of growth in jobs, wages, and performance of the high-tech industries in cities are based on Moody’s Analytics data sourced from the Bureau of Labor Statistics.
To provide a comprehensive assessment of cities’ performance and the economic well-being of their residents, the BPC index also includes measures of access to economic opportunities, such as housing affordability and broadband internet coverage. Recognizing the importance of sustainable and equitable growth, the 2024 BPC index also includes metrics of communities' ability to respond to economic and natural disasters and income inequality. The four measures of access to economic opportunities are based on the American Community Survey one-year (2022) data.
To facilitate the interpretation of the BPC rankings, cities are divided into five tiers based on their BPC index scores. The tiers are created by dividing the full range of the BPC scores (i.e., the difference between the highest and lowest score) into five consecutive subsegments of equal length. Cities are classified into these tiers depending on which of the five subsegments their scores fall into. This methodology results in the number of cities in each tier depending on the distribution of scores along the full range of the index.(4) The classification of cities into tiers is done separately for large and small cities.
Notes
(1) The delineations of metropolitan statistical areas and metropolitan divisions used in the 2023 BPC report correspond to those outlined in OMB Bulletin No. 18-03, released on April 10, 2018. Since then, the OMB has updated its definition of MSAs and MDs as described in OMB Bulletin No. 18-04, released on September 14, 2018. However, the Bureau of Labor Statistics (BLS) continues to use the geographic definitions based on OMB Bulletin No. 18-03. Since the BPC index is calculated using measures based on BLS data, the geographic definitions used throughout the report and in the index correspond to the April 2018 definitions used by the BLS.
(2) See “OMB Bulletin No. 18-03,” White House, Appendix, p.2, available at https://www.whitehouse.gov/wp-content/uploads/2018/04/OMB-BULLETIN-NO.-….
(3) See Part IX Office of Management and Budget, “Standards for Defining Metropolitan and Micropolitan Statistical Areas; Notice,” Federal Register, December 27, 2000, https://www.govinfo.gov/content/pkg/FR-2000-12-27/pdf/00-32997.pdf.
(4) As an example, if BPC index scores fell between 10 and 60, Tier 1 would include all cities with scores between 10 and 20, Tier 2 would include cities with scores between 20.01 and 30, and so on, consecutively until Tier 5, which would include cities with scores between 50.01 and 60.
Looking for more information about Best-Performing Cities?
Contact Research Senior Director, Maggie Switek.
Want to learn more about Milken Institute research? See the breadth of our work on the Research Department page.
Small Cities
Best-Performing Cities' (BPC) small cities include the 203 less populated (relative to BPC’s large cities) US metropolitan areas. As large cities, small cities are further divided into five tiers based on their relative performance, with top-ranked cities in Tier 1 and bottom-ranked cities in Tier 5. The interactive figure below shows small cities’ rankings on the 13 components of the index.
Looking for more information about Best-Performing Cities?
Contact Research Senior Director, Maggie Switek.
Want to learn more about Milken Institute research? See the breadth of our work on the Research Department page.
Large Cities
Best-Performing Cities' (BPC) large cities include the 200 most populous US metropolitan areas. Large cities are further divided into five tiers based on their relative performance, with top-ranked cities in Tier 1 and bottom-ranked cities in Tier 5. The interactive figure below shows large cities’ rankings on the 13 components of the index.
Looking for more information about Best-Performing Cities?
Contact Research Senior Director, Maggie Switek.
Want to learn more about Milken Institute research? See the breadth of our work on the Research Department page.
Best-Performing Cities
About Best-Performing Cities
Welcome to the Best-Performing Cities (BPC) webpages. The BPC rankings offer an objective evaluation of the economic performance of US metropolitan areas based on 13 indicators that cover labor market conditions, high-tech impact, and access to economic opportunities. This year, two new metrics are incorporated into the index: community resilience and income inequality.
Read Report
To ensure that population size doesn't skew our results, we've divided US metropolitan areas into 200 large and 203 small cities. We've then classified these cities into five tiers, with Tier 1 being the highest-ranked cities and Tier 5 being the lowest-ranked cities. You can learn more about BPC's large and small cities by using the navigation buttons at the top of the page.
Our interactive map allows you to compare cities' performance relative to their peers, determined by city size and ranking tier. We invite you to gain valuable insights into the economic performance of US metropolitan areas across the 13 BPC components by using the buttons on the right side of the figure.
Interactive Map
To learn more about the methodology used for the BPC rankings, visit our methodology page.
Latest Best-Performing Cities Reports
Read All

Meet the 2024 Contributors
Looking for more information about Best-Performing Cities?
Contact Research Senior Director, Maggie Switek.
Want to learn more about Milken Institute research? See the breadth of our work on the Research Department page.