The COVID-19 Community Explorer provides a simple way to explore geographic clusters of county-communities affected by the pandemic and their socioeconomic, demographic, and health-related features. More specifically, it clusters 751 variables (behavioral, demographic, economic, and social factors) for 3142 counties into 17 population profiles using machine learning techniques. More details on the Community Explorer.
Interactive Map
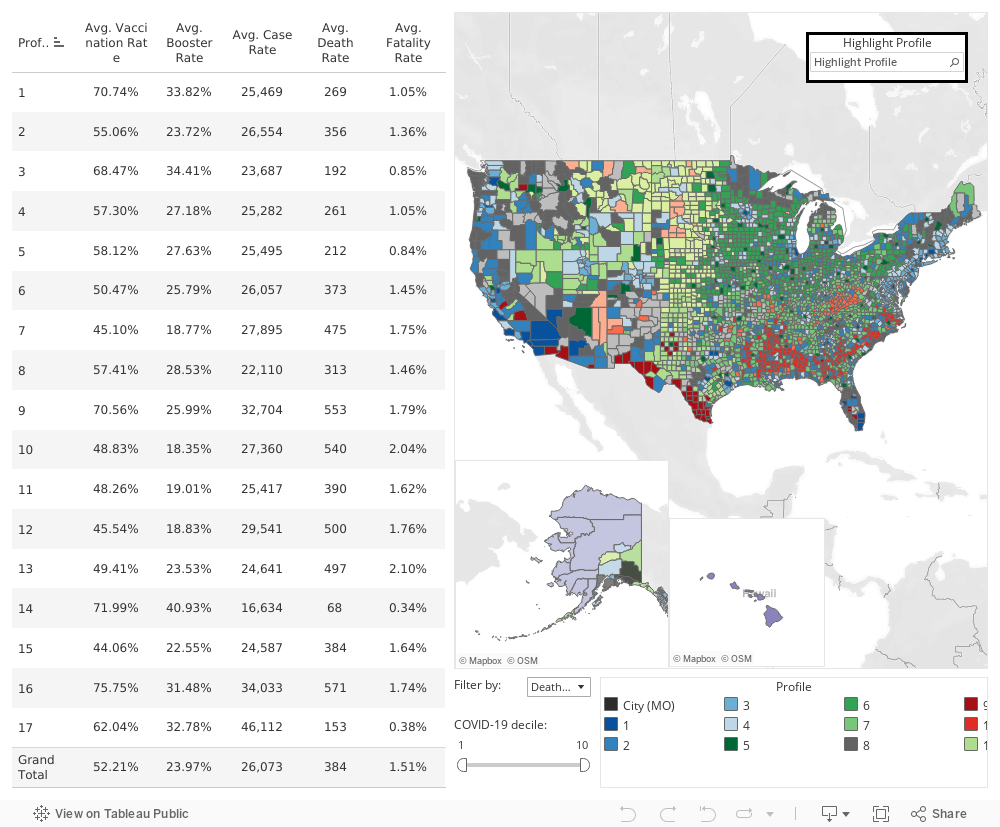
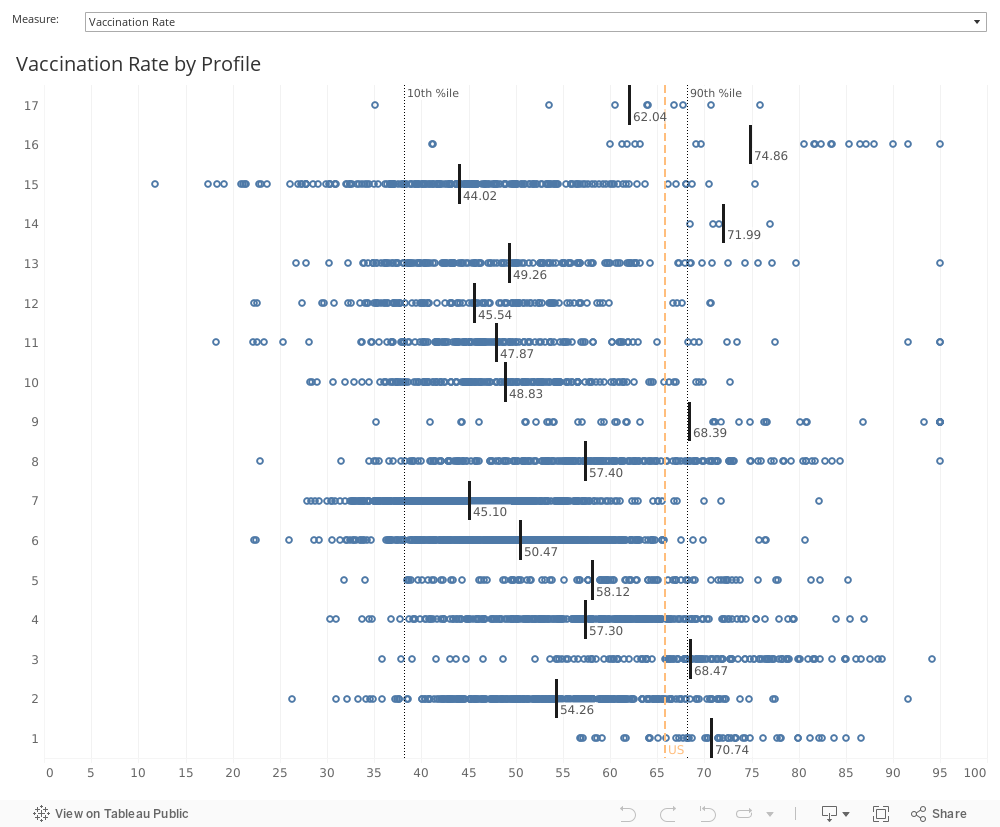
Interactive Distributions across Profiles
The 17 profiles are the result of clustering analysis of 751 variables (behavioral, demographic, economic, and social factors) for 3142 counties using machine learning techniques. THey can be summarized as follows:
Mainstream America captures 74% of the US population and encompasses Urban Core counties and Suburban and Small Metro counties (819 counties).
1 => The most ethnically diverse profile with the highest income level. It is a highly educated cohort that resides in large metro areas 26% of the US population)
2 => Mainly includes less populous suburban and small Metro counties which are not as economically prosperous as the other mainstream America counties (18%)
3 => Includes affluent and more populous suburban and small metro counties with at least 1 million residents (16%)
4 => Capture the middle-class populations that reside in large- to medium-sized Suburban and Small Metro counties (14%)
Industry-driven America captures 17% of the US population and encompasses counties concentrated in one industry which shapes all aspects of their population’s profile (1507 counties).
5 => College towns (5.4%)
6 => Manufacturing, transportation, equipment and machinery in the Midwest (5.2%)
7 => Low-wage manufacturing and chemical industries in the South (4.9%)
11 => Agricultural communities (1.2%)
15 => Agriculture on the part of the Great Plains (0.3%)
Graying America captures 5.1% of the US population and encompasses counties with with the highest concentration of 65 years and up populaton. (378 counties)
8 => Decent retiree communities (4.5%)
13 => Lonely seniors with the highest disability rate (0.6%)
Impoverished America captures 3.5% of the US population and encompasses counties with the lowest levels of income. (424 counties)
9 => Extreme poverty on the U.S. southern border (1.4%)
10 => Persistent poverty among Black or African American populations (1.3%)
12 => Non-Hispanic White poverty in the Upper South (0.7%)
16 => Extreme poverty in American Indian Reservation regions (0.1%)
Noncontiguous America captures 0.42% of the US population and encompasses all Hawaiian counties and nine of Alaskan counties (34 counties).
14 => Aloha State (0.4%)
17 => The largest economic gaps between White and Alaska Natives(0.02%)
Data
BRFSS, CDC's Diabetes Surveillance System, Centers for Medicare & Medicaid Services, Robert Wood Johnson Foundation's County Health Rankings, United Health Foundation's America's Health Rankings, Census Bureau's American Community Survey, Bureau of Labor Statistics, Department of Agriculture.
List of Health Conditions
• Adult Obesity: Adult obesity prevalence (%)
• Adult Smoking: Rate of smoking adults (%)
• Air Pollution Levels: Average daily density of fine particulate matter in micrograms per cubic meter (PM2.5)
• Asthma Among 65 and Older: Asthma prevalence (%) among 65 and older
• Chronic Kidney Disease Among 65 and Older: Chronic Kidney Disease prevalence (%) among 65 and older
• Diabetes Among 65 and Older: Diabetes prevalence (%) among 65 and older
• Diabetes Prevalence: Diabetes prevalence (%) • Alzheimer's Disease and Dementia: Alzheimer's Disease and Dementia prevalence (%)
• Excessive Drinking: Percentage of adults reporting binge or heavy drinking
• Food Environment Index: Index of factors that contribute to a healthy food environment
• Food Insecurity Prevalence: Percentage of population who lack adequate access to food
• Frequent Mental Distress: Percentage of adults reporting 14 or more days of poor mental health per month
• Frequent Physical Distress: Percentage of adults reporting 14 or more days of poor physical health per month
• Heart Failure Among 65 and Older: Heart Failure prevalence (%) among 65 and older
• Hypertension Among 65 and Older: Hypertension prevalence (%) among 65 and older
• Ischemic Heart Disease among 65 and Older: Ischemic Heart Disease prevalence (%) among 65 and older
• Limited Access to Healthy Foods: Percentage of population who are low-income and do not live close to a grocery store
• Physical Inactivity: Percentage of adults age 20 and over reporting no leisure-time physical activity
• Poor Mental Health Days: Average number of mentally unhealthy days (#)
• Social Association Rate: Number of membership associations per 10,000 population
• Stroke Among 65 and Older: Stroke prevalence (%) among 65 and older
Related Projects
- The Community Explorer ** beta version ** (17 profiles based on 751 factors)
- The Community Explorer: Informing Policy with County-Level Data
- COVID-19 Community Explorer
- Weighing Down America: 2020 Update
Contact Us
For questions and comments: [email protected].